J Biomed 2018; 3:8-12. doi:10.7150/jbm.23267 This volume Cite
Research Paper
Eicosapentaenoic Acid Reverses the Oleic Acid-induced Reduction in Per1 mRNA Expression in Cultured Rat Hepatocytes
Chinami Nagura1, Sho Tanaka1, Akiko Tsunemi1, Akira Haketa1, Takashi Maruyama1, Takahiro Ueno1 ![]() , Noboru Fukuda1, Masayoshi Soma2, Masanori Abe1
, Noboru Fukuda1, Masayoshi Soma2, Masanori Abe1
1. Division of Nephrology, Hypertension and Endocrinology, Department of Medicine, Nihon University School of Medicine, Tokyo, Japan;
2. Division of General Medicine, Department of Medicine, Nihon University School of Medicine, Tokyo, Japan.
Received 2017-10-10; Accepted 2017-11-12; Published 2017-11-29
Abstract

The aim of the present study was to examine the conditions and chemicals that affect the expression of circadian clock-related genes in obesity. We investigated the expression of Per1 mRNA in H35 cultured rat hepatoma cells. Incubation with 100 nM dexamethasone for 2 h increased Per1 mRNA expression successfully in H35 rat hepatoma cells after 19 h or 22 h of stimulation. Further, 50 mM oleic acid (OA) loading resulted in marked accumulation of triglycerides in H35 cells and decreased the elevated levels of dexamethasone-induced Per1 mRNA after 19 h or 22 h of stimulation. Resveratrol and niacin did not show any effect on Per1 mRNA expression in H35 cells. However, eicosapentaenoic acid (EPA) reversed the OA-induced reduction in Per1 mRNA after dexamethasone stimulation in the cultured cells. These data suggest the possible role of EPA as an agent to modify the circadian clock oscillation.
Keywords: Per1, clock gene, eicosapentaenoic acid.
Introduction
Prevalence of obesity is increasing worldwide. Obesity is frequently associated with many cardiovascular anomalies, such as diabetes mellitus, hyperlipidemia, and hypertension. It is a major reason behind morbidity and mortality among patients affected with cardiovascular diseases. Obesity is induced by disturbances in the energy homeostasis whose components, including sleeping, thermogenesis, feeding, and glucose and lipid metabolism, are under the control of circadian regulation. Circadian rhythms are regulated by a multioscillator system. The central clock is located within the suprachiasmatic nucleus (SCN) of the brain, which produces a rhythmic output controlled by neural and hormonal signals. The SCN clock is reset by external light and triggered through the ganglion cells of the retina. Circadian oscillators are in fact present in all the tissues, where they are synchronized by unidentified signals to regulate transcriptional activity throughout the day1-3. Circadian gene expression is maintained through a transcription-translation negative feedback loop. The primary loop is composed of the basic helix-loop-helix transcription factors: circadian locomoter output cycles protein kaput (CLOCK) and brain and muscle Arnt-like protein-1 (BMAL1). These transcription factors drive expression of Period (Per1, Per2) and Cryptochrome (Cry1, Cry2) genes4,5. CLOCK and BMAL1 also dimerize to form the CLOCK-BMAL1 complex, which subsequently induces the expression of a large number of output genes. Interplay between metabolism and the circadian clock has been suggested by several lines of evidence6-8.
We previously investigated the association between the expression profile of clock genes and obesity using human peripheral blood mononuclear cells (PBMCs). The expression profiles of these genes in obese subjects were apparently different from those in non-obese subjects. Because Per1 among the several clock genes examined in the study showed the most apparent difference between obese and non-obese subjects9, we focused on Per1 in this study. However, the reason behind the altered clock gene expression profile in obese subjects is not completely clear yet. To understand the mechanism of this alteration, in vitro examination of the clock gene expression profile is needed. Importantly, fatty liver is one of the common complications of obesity. Since cultured hepatocytes seem to be useful in evaluating the influence of fat or glucose loading agents on clock gene expression, in this study, we also tried to determine the conditions that alter the expression of clock genes in cultured hepatocytes.
Methods
Determination of mRNA expression
For in vitro experiments, H35 cells were cultured in Dulbecco's modified eagle medium (DMEM) containing 10% fetal calf serum (FCS). Total RNA was isolated and reverse-transcribed to cDNA as described previously9. Real-time quantitative PCR (RTq-PCR) was performed with four times diluted cDNA using TaqMan Universal Master Mix (Applied Biosystems, Foster city, CA, USA) and ABI 7500 real-time PCR system (Applied Biosystems) according to the manufacturer's instructions. Assay-on-demand primers and probes were purchased from Applied Biosystems (Per1, Applied Biosystems). 18S rRNA expression (Applied Biosystems) was quantified for sample normalization. RT-qPCR data were analyzed using a standard curve. In all these cases, correlation coefficients for the standard curves were > 0.90.
Synchronization of H35 cells
To synchronize the clock gene oscillation, we tried stimulating the H35 cells with high concentration of horse serum and dexamethasone. After 24 h of culture with DMEM containing 0.5% FCS, H35 cells were subcultured in DMEM containing 50% horse serum or 100 nM dexamethasone for 2 h. Next, the cells were transferred to DMEM containing 15% FCS for 19 h or 22 h. Per1 mRNA levels were quantified by RT-qPCR before and after 19 h or 22 h of synchronization.
To examine the effect of glucose on Per1 mRNA expression pattern after synchronization, H35 cells were incubated with 50 mM or 100 mM glucose. Next, Per1 mRNA was quantified by RT-qPCR before and after 18 h and 22 h of synchronization.
To determine the most effective stimulation to induce triglyceride accumulation, H35 cells were incubated with 50 mM fatty acids Eicosapentaenoic acid (EPA), arachidonic acid (AA), oleic acid (OA), or palmitic acid (PA) or 50 mM cholesterol for 24 h or 72 h. After incubation with lipids, Per1 mRNA was quantified by RTq-PCR.
To examine the effect of OA on Per1 mRNA expression pattern after synchronization, H35 cells were incubated with 400 μM OA. Per1 mRNA was quantified by RTq-PCR before and after 18 h and 22 h of synchronization.
To find a condition that can reverse the OA-induced decrease of Per1 mRNA expression, H35 cells were treated with 20 μM resveratrol, 500 μM niacin, and 50 μM or 110 μM eicosapentaenoic acid. Further, cells were treated with 100 nM dexamethasone for 2 h, and Per1 mRNA was quantified by RTq-PCR before and after 18 h and 22 h of synchronization.
Statistical analysis
Results are shown as the mean ± standard error of the mean (SEM). The significance of differences between mean values was evaluated by Student's t-test for unpaired data. A p value less than 0.05 was considered significant.
Results
Evaluation of synchronization of Per1 mRNA oscillation
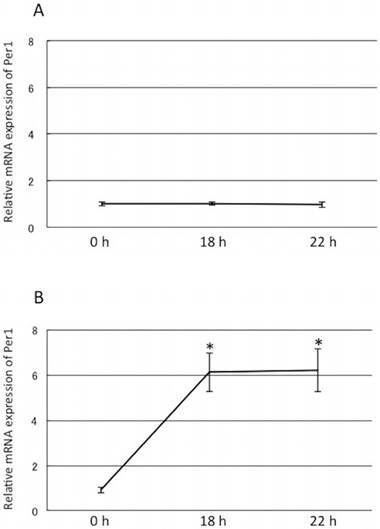
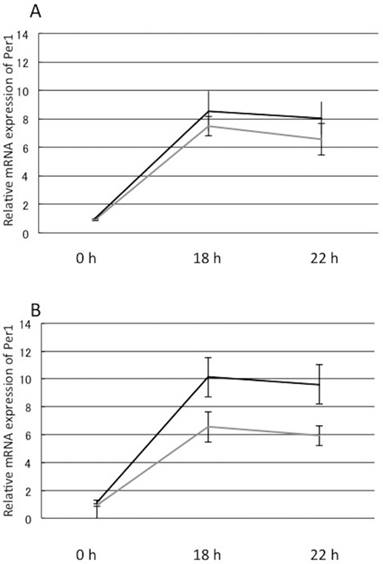
To find a suitable stimulation to synchronize Per1 mRNA oscillation, we evaluated the effect of 50% horse serum stimulation on Per1 mRNA. However, Per1 mRNA levels did not change after 50% horse serum stimulation. We also evaluated the effect of dexamethasone on Per1 mRNA levels. Dexamethasone (100 nM) addition led to a six-fold increase in Per1 mRNA levels at 18 h and 22 h in comparison to those before the treatment.
Effect of high glucose on Per1 mRNA levels in H35 cells
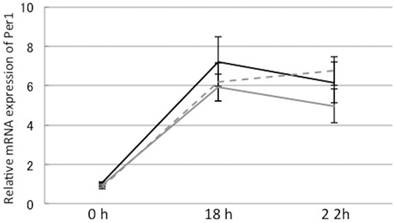
We evaluated the effect of high glucose on Per1 mRNA in H35 cells. Per1 mRNA levels were not affected by treatment with 50 mM glucose and 100 mM glucose after dexamethasone synchronization.
Effects of fatty acids and cholesterol on triglyceride accumulation in H35 cells
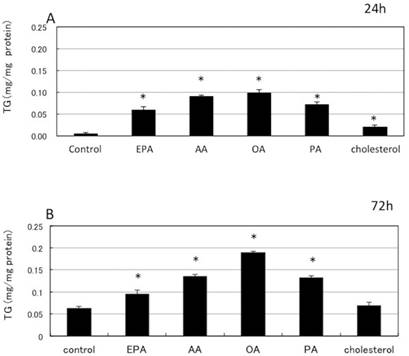
Incubation with EPA, AA, OA, PA, or cholesterol resulted in significant increase in the cellular triglycerides after 24 h. Similarly, incubation with EPA, AA, OA, or PA caused significant increase in the cellular triglycerides after 72 h. Incubation with only OA for 72 h led to maximum accumulation of triglycerides in H35 cells.
Influence of lipid accumulation on dexamethasone-induced Per1 mRNA expression
Incubation with 400 μM OA decreased dexamethasone-induced Per1 mRNA oscillation after 18 h and 22 h.
Influence of resveratrol, niacin, and EPA on OA-induced reduction of Per1 mRNA peaks after dexamethasone treatment
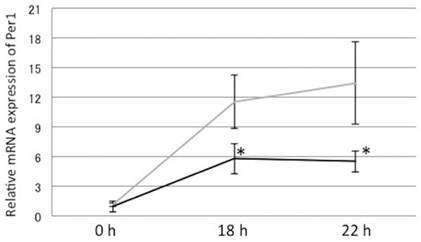
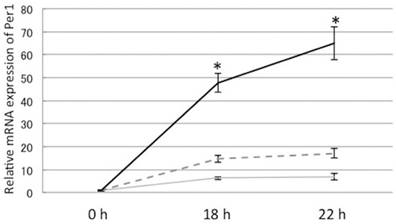
OA-induced decrease in Per1 mRNA levels was not reversed by treatment with 20 μM resveratrol and 500 μM niacin after dexamethasone treatment. Furthermore, 50 μM EPA could also not increase the Per1 mRNA levels, but 110 μM EPA significantly increased Per1 mRNA in OA-loaded cells after 18 h and 22 h of dexamethasone treatment.
Dexamethasone but not horse serum stimulation increased Per1 mRNA expression A: 50% horse serum stimulation did not change Per1 mRNA levels. B: Dexamethasone (100 nM) increased Per1 mRNA levels by six folds at 18 h and 22 h compared to time 0. Y-axis represents mRNA expression of Per1 with respect to that of 18s. *: p<0.05 vs 0 h, mean±S.E
High glucose did not alter Per1 mRNA levels in H35 cells. Gray line: control, Dashed line: 50 mM glucose, Solid line: 100 mM glucose. Y-axis represents mRNA expression of Per1 with respect to that of 18s. Mean±S.E.
Incubation with fatty acids and cholesterol resulted in significant increase in the cellular triglycerides. A: 24 h incubation with fatty acids and cholesterol resulted in significant increase in the cellular triglycerides. B: 72h incubation with fatty acids and cholesterol resulted in significant increase in the cellular triglycerides. EPA (eicosapentaenoic acid), AA (arachidonic acid), OA (oleic acid), PA (palmitic acid). Mean±S.E, *: p<0.05 vs control.
Incubation with 400 μM OA decreased dexamethasone-induced Per1 mRNA oscillation after 18 h and 22 h. Gray line: control; Solid line: 400 μM oleic acid, Y-axis represents mRNA expression of Per1 with respect to that of 18s. *: p<0.05 vs control, mean±S.E
OA-induced decrease in Per1 mRNA levels was not reversed by treatment with 20 μM resveratrol and 500 μM niacin after dexamethasone treatment. A: OA-induced decrease in Per1 mRNA levels was not reversed by treatment with 20 μM resveratrol. Gray line: control, Solid line: 20 μM resveratrol, mean±S.E B: OA-induced decrease in Per1 mRNA levels was not reversed by treatment with 500 μM niacin. Gray line: control, Solid line: 500 μM niacin, mean±S.E Y-axis represents mRNA expression of Per1 with respect to that of 18s.
110 μM EPA significantly increased Per1 mRNA in OA-loaded cells after 18 h and 22 h of dexamethasone treatment. Gray line: control, Dashed line: 50 μM EPA, Solid line: 110 μM EPA, *: p<0.05 vs. control, mean±S.E Y-axis represents mRNA expression of Per1 with respect to that of 18s.
Discussion
In our previous study, we evaluated the mRNA expression profile of the genes implicated in circadian regulation using PBMCs of the obese subjects. Oscillation pattern of mRNA expression of circadian clock-related genes in the obese subjects was apparently different from that in the healthy subjects. Among the circadian clock-related genes, difference of oscillation pattern between obese and non-obese subjects was most evident in the case of Per1 gene.
For further examination of the influence of obesity on clock gene expression, in vitro study is a fast and informative method. Balsalobre et al. reported that serum shock induces circadian clock gene oscillation in cultured fibroblasts and hepatocytes10. Dexamethasone also induces circadian rhythm of clock genes in culture cells by type 0 phase resetting11. Because fatty liver is the most common and important complication of obesity, we used cultured hepatocytes to evaluate the effect of fat accumulation on Per1 gene oscillation. Horse serum loading (50%) did not affect Per1 mRNA expression. However, dexamethasone stimulation increased Per1 mRNA expression in H35 hepatoma cells.
To evaluate the influence of fat accumulation on Per1 mRNA expression, we first tried to find a suitable condition for accumulation of triglycerides in H35 cells. We examined several fatty acids and cholesterol and found that OA loading was the most effective to increase triglyceride storage in H35 cells. Dexamethasone-induced Per1 mRNA expression was decreased in the cells loaded with oleic acid. Because high blood glucose is another frequently associated complication of obesity, we examined the effect of high glucose on dexamethasone-induced Per1 mRNA expression. However, high glucose levels did not affect Per1 mRNA expression. In our previous study, Per1 mRNA oscillation was decreased in the obese subjects. The same trend was observed in the triglyceride-accumulated cultured hepatocytes. These findings suggest that the accumulation of triglycerides in hepatocytes possibly decreases the circadian clock oscillation.
Resveratrol mimics the effects of calorie restriction via activation of sirtuin 1, which is an important player in the regulation of cellular energy homeostasis. Sirtuins are NAD-dependent deacetylases, which regulate glucose and lipid metabolism and participate in the pathophysiology of hepatic steatosis12. We evaluated the effect of resveratrol on Per1 mRNA reduction induced by oleic acid loading. However, resveratrol did not increase Per1 mRNA expression. These findings suggest that obesity-induced reduction in Per1 mRNA is not directly linked with the energy homeostasis.
Niacin is effective in the regulation of glucose metabolism and NAD-sirtuin pathway, which may be related to the altered mitochondrial biogenesis13,14. We examined the effect of niacin on OA-induced Per1 mRNA reduction. However, niacin did not show any significant effect on Per1 mRNA expression.
EPA loading successfully improved OA-induced Per1 mRNA reduction. Furutani et al. reported that fish oil facilitates restriction feeding-induced entrainment of the peripheral clock. The entrainment by fish oil supplementation was attenuated in G protein-coupled receptor 120 (GPR120)-deficient mice15. GPR 120 is the putative receptor for omega-3 fatty acid including EPA and docosahexaenoic acid (DHA). It has also been reported that easily digestible carbohydrates facilitate restriction feeding-induced peripheral clock entrainment16,17. Our results along with these previous findings indicate that EPA might improve obesity-induced circadian clock dysfunction through GPR120 signaling.
In this study, we successfully evaluated clock gene expression in cultured rat hepatocytes. As the circadian clock system is orchestrated by the interaction of the central clock and peripheral clocks, evaluation of the peripheral clock in cultured cells is convenient and quick method. However, evaluation should also be performed in vivo to estimate the interaction of the central and peripheral clocks.
In conclusion, oleic acid loading decreased Per1 mRNA expression in cultured hepatocytes. Among several agents examined in this study, only EPA reversed the OA-induced reduction in Per1 mRNA expression in the cultured cells. These data suggest that EPA can be employed as an agent to modify circadian clock oscillation.
Competing Interests
The authors have declared that no competing interest exists.
References
1. Buijs RM, Kalsbeek A. Hypothalamic integration of central and peripheral clocks. Nat Rev Neurosci. 2001;2(7):521-6
2. Buijs RM, van Eden CG, Goncharuk VD, Kalsbeek A. The biological clock tunes the organs of the body: timing by hormones and the autonomic nervous system. J Endocrinol. 2003;177(1):17-26
3. Kalra SP, Dube MG, Pu S, Xu B, Horvath TL, Kalra PS. Interacting appetite-regulating pathways in the hypothalamic regulation of body weight. Endocr Rev. 1999;20(1):68-100
4. Lowrey PL, Takahashi JS. Mammalian circadian biology: elucidating genome-wide levels of temporal organization. Annu Rev Genomics Hum Genet. 2004;5:407-41
5. Reppert SM, Weaver DR. Coordination of circadian timing in mammals. Nature. 2002;418(6901):935-41
6. Kaasik K, Lee CC. Reciprocal regulation of haem biosynthesis and the circadian clock in mammals. Nature. 2004;430(6998):467-71
7. Rutter J, Reick M, McKnight SL. Metabolism and the control of circadian rhythms. Annu Rev Biochem. 2002;71:307-31
8. Tu BP, McKnight SL. Metabolic cycles as an underlying basis of biological oscillations. Nat Rev Mol Cell Biol. 2006;7(9):696-701
9. Tahira Y, Fukuda N, Endo M, Suzuki R, Ikeda Y, Takagi H. et al. Transforming growth factor-beta expression in cardiovascular organs in stroke-prone spontaneously hypertensive rats with the development of hypertension. Hypertens Res. 2002;25(6):911-8
10. Balsalobre A, Damiola F, Schibler U. A serum shock induces circadian gene expression in mammalian tissue culture cells. Cell. 1998;93(6):929-37
11. Okubo N, Minami Y, Fujiwara H, Umemura Y, Tsuchiya Y, Shirai T. et al. Prolonged bioluminescence monitoring in mouse ex vivo bone culture revealed persistent circadian rhythms in articular cartilages and growth plates. PLoS One. 2013;8(11):e78306
12. Haigis MC, Guarente LP. Mammalian sirtuins-emerging roles in physiology, aging, and calorie restriction. Genes Dev. 2006;20(21):2913-21
13. Revollo JR, Grimm AA, Imai S. The NAD biosynthesis pathway mediated by nicotinamide phosphoribosyltransferase regulates Sir2 activity in mammalian cells. J Biol Chem. 2004;279(49):50754-63
14. Yang SJ, Choi JM, Kim L, Park SE, Rhee EJ, Lee WY. et al. Nicotinamide improves glucose metabolism and affects the hepatic NAD-sirtuin pathway in a rodent model of obesity and type 2 diabetes. J Nutr Biochem. 2014;25(1):66-72
15. Furutani A, Ikeda Y, Itokawa M, Nagahama H, Ohtsu T, Furutani N. et al. Fish Oil Accelerates Diet-Induced Entrainment of the Mouse Peripheral Clock via GPR120. PLoS One. 2015;10(7):e0132472
16. Hirao A, Tahara Y, Kimura I, Shibata S. A balanced diet is necessary for proper entrainment signals of the mouse liver clock. PLoS One. 2009;4(9):e6909
17. Oike H, Nagai K, Fukushima T, Ishida N, Kobori M. Feeding cues and injected nutrients induce acute expression of multiple clock genes in the mouse liver. PLoS One. 2011;6(8):e23709
Author contact
![]() Corresponding author: Takahiro Ueno, M.D., Ph.D., Division of Nephrology, Hypertension and Endocrinology, Department of Medicine, Nihon University School of Medicine. Address: 30-1 Oyaguchi-kami, Itabashi 173-8610, Tokyo, Japan; Phone: 81-3-3972-8111, ext. 2711; Fax: 81-3-3972-8666; E-mail: takahiro-uenoac.jp
Corresponding author: Takahiro Ueno, M.D., Ph.D., Division of Nephrology, Hypertension and Endocrinology, Department of Medicine, Nihon University School of Medicine. Address: 30-1 Oyaguchi-kami, Itabashi 173-8610, Tokyo, Japan; Phone: 81-3-3972-8111, ext. 2711; Fax: 81-3-3972-8666; E-mail: takahiro-uenoac.jp